09 Mar 2019
I’ve given a talk about scaling graphite with go-carbon a few times now, and in a way it was an excuse to try and do some talks at meetups. Really it should have just been a blog post, so here’s that blog post!
There’s a lot of information out there about scaling up the stock python graphite components, such as:
But I’d been hearing about large graphite sites re-writing those components in other languages like C or go to address some of the issues they were having running graphite at scale. When it came to investigating these solutions, the biggest challenge was piecing together an appropriate architecture and configuration for your needs - most of the information for this is hidden in github issues for the project, or spread across different pieces of documentation.
Our Architecture
With the python graphite components, we had reached the following architecture to meet our performance and HA requirements.
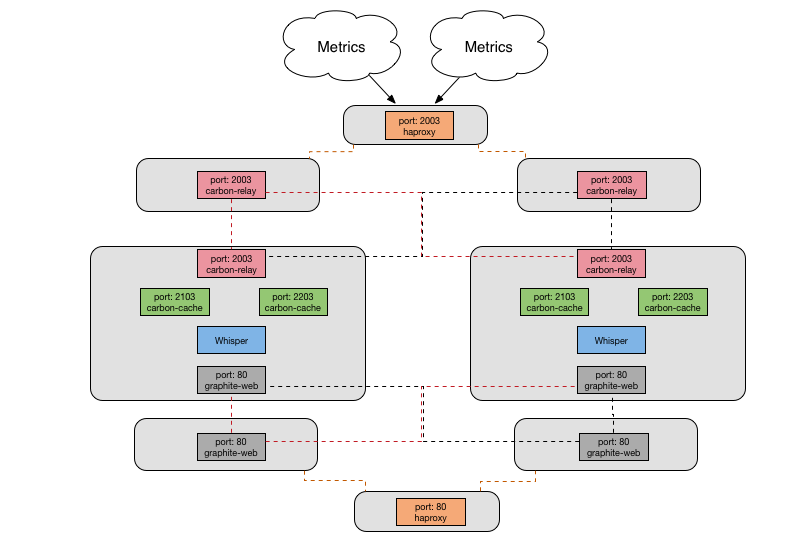
- Cluster of HAProxy servers, using BGP to route traffic to the active cluster member. This fronts carbon-relay for ingesting metrics, and apache for serving them.
- Two relay nodes, with incoming traffic being split between them by HAProxy, and sending all received metrics to both cache nodes
- Two cache nodes, each running:
- Haproxy to ingest metrics and then splitting the traffic between multiple carbon-relay instances
- Two carbon relay then shards those incoming metrics between multiple carbon-cache daemons
- Four carbon cache daemons to write the metrics out to whisper files on disk
- Apache to run graphite-web and serve metrics
- Two web nodes, running grafana for dashboards and graphite-web to serve a federated view of the cache nodes.
As the amount of metrics we collected grew, the bottleneck we kept hitting is that a carbon-cache process would hit 100% CPU and we would end up dropping metrics. We could keep adding more processes, but that couldn’t go on forever on a single node, and we would have to start sharding our metric data between multiple cache nodes, which I wanted to avoid.
carbon-c-relay
https://github.com/grobian/carbon-c-relay
carbon-c-relay supports all the same features as carbon-relay, but with lower resource consumption and it also supports regex based conditional forwarding to receivers.
But the biggest benefit of changing to carbon-c-relay is it’s larger cache.
The only tuning we needed to do was:
queuesize - default 2500 too low, 5million+
Each configured server that the relay sends metrics to has a queue associated with it. This queue allows for disruptions and bursts to be handled. Constraining the queue size limits memory consumption, but setting it too low risks you losing metrics. We have set it to 5 million, this has provided enough capacity that if you need to perform a short maintenance on a cache node involving a reboot, then we don’t drop any metrics. Previously with carbon-relay this wasn’t the case.
backlog - default 32, we use 128
backlog sets the TCP connection listen backlog. If you have a lot of concurrent connections you need to increase this to avoid connection refused errors on clients
co-carbon
https://github.com/lomik/go-carbon
On the cache nodes we evaluated and decided to implement go-carbon. go-carbon is a Golang implementation of Graphite/Carbon server with the same internal architecture: Agent -> Cache -> Persister
go carbon proved to be a good choice because it has lower resource consumption, and also it’s a single multithreaded process - this removes the config sprawl required when running so many single-threaded relay and cache processes.
It supports all the same input methods as python carbon, plus a few more, and supports that carbonlink protocol that allows graphite-web to query the cache. And it has some neat features, like persisting the in-memory cache to disk during a restart, whereas python carbon-cache would just lose whatever metrics are in the cache during a process restart.
There are a bunch more tuning variables required to get go-carbon working well.
CPU Tuning
max-cpu - this sets GOMAXPROCS. Use number of cores
workers - persister worker threads. Use number of cores
These two settings configure how much CPU resources can be used - obviously, having more persister workers is important for throughput.
Cache Tuning
max-size - set high, we use 10million
It’s important to have a big enough cache size to handle any increases in the rate of incoming metrics, or slow downs in the rate of metrics being written. The number is dependant on the resolution of your data and how many metrics you receive in that period. In our current case, we are receiving about 1.5million metrics a minute, and most of the metrics are 60 second resolution so 10 million is a high enough cache size for now. During normal operation the cache size sits about 1.5 - 2 million.
write-strategy - set to noop
write-strategy defines what order metrics are persisted to disk from the cache. It’s also possible to choose other strategies - either the oldest point first, or the metric with the most unwritten points. noop means “unspecified order” which requires the least CPU and improves cache responsiveness and performance.
I/O Tuning
sysctl settings:

sysctl -w vm.dirty_ratio = 80
sysctl -w vm.dirty_background_ratio = 50
sysctl -w vm.dirty_expire_centisecs = $(( 10*60*100 ))
go-carbon doesn’t try and be too smart about writes - but you need to tune the OS so that go-carbon is never blocked on writes. So we configure these sysctl settings, which come directly from the project README, to tune the kernel disk buffers. The kernel will then take multiple datapoint writes, and coalesce them into a single disk write performed in the background.
- dirty_ratio - percentage of RAM which can be left unwritten to disk
- dirty_background_ratio - percentage of RAM when the background writer starts writes to disk
- dirty_expire_centisecs - this means that memory pages shouldn’t left dirty for longer than 10mins
max-updates-per-second - we use 10k
max-updates-per-second is the most important configuration setting to optimise performance. It’s name is confusing, at first I thought it is a limit on throughput. in fact, once the amount of datapoints needing to be written goes above the setting value limit, go-carbon will start writing out multiple datapoints per update. so this provides control to limit the amount of IOPs the server needs to perform, and means increasing the cache as datapoints need to be stored in the cache for longer so that go-carbon can write out multiple datapoints for each metric per update.
max-creates-per-second - 15
A really useful feature that python carbon supports is max creates per minute, and happily go-carbon started supporting it in 0.13.
The first time a metric is seen, then carbon will lay out a new whisper file. This means writing out the entire content of the file, which is a lot more IO than just updating a few datapoints. This absolutely kills the update performance of the carbon persister and can affect search performance. So, this setting will rate limit the number of new whisper files being created.
I’ve not yet updated to 0.13, we’re running 0.11, but on python graphite we set this to 1000 per minute, so I’d use a similar value scaled down to seconds here.
Resources
Enough cores - 2x Xeon E5-2630 2.40GHz maxed out at 3million metrics/minute in my tests
As for system resources, you need enough CPU to manage your workload, I found I couldn’t scale beyond 3m/min with 2 CPUs in the lab, so we run with more cores in production to give more headroom.
Ram to support disk buffers - was 24GB, maxed out at ~1.2million metrics/minute, now 48GB ... and fast SSDs
The most important resource is I/O throughput. Obviously you need fast enough disks on the backend, but having a large disk buffer in RAM is vital for the operation of go-carbon.
This is because each write to a whisper file requires multiple reads. Also if your whisper files have multiple retention periods, the aggregated points are written to every write, requiring a read of all points in the highest precision that cover that aggregated period. Basically, more cache results in less disk reads.
So there’s a relationship between the max-writes-per-second setting, the size of your in-memory cache, as well as having a large enough kernel disk cache, that provide the tunings required to get the maximum performance for your hardware from go-carbon.
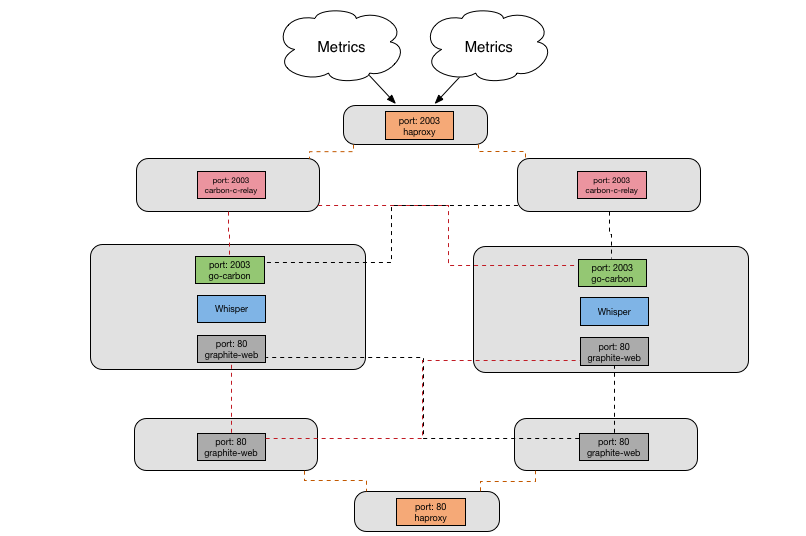
Current Architecture
Now we have our current architecture - go-carbon has replaced all the carbon components, as well as haproxy, on the cache nodes. We still have our node sprawl to support redundancy, but the configuration on each node is much more straightforward with one go process and fewer configuration options needing to be set.
07 Sep 2018
Prometheus for Practitioners: Migrating to Prometheus at Fastly - Marcus Barczak, Fastly
First monitoring system: Ganglia + Icinga. Tried to move to SaaS, ended up supporting two systems, growing pains doubled.
Company infrastructure was scaling horizontally, require scaling monitoring vertically.
Project to review monitoring and replace existing systems: scale with infrastructure growth, easy to deploy and operate, engineer friendly instrumentation, first class API support.
Get started:
- build proof of concept
- pair with pilot team to instrument their services
- iterate through the rest
Infrastructure:
- Pair of instances in each POP, both scraping same devices in the POP.
- Frontend in GCP. Grafana, nginx router, federation and alert manager.
Prometheus server:
- ghost tunnel, tls termination and auth
- service discovery sidecar
- rules loader
Created their own service discovery and proxy for prometheus.
Rough Edges:
- Metrics exploration without prior knowledge
- Alertmanager too flexible
- Federation and global views
- Long term storage still an open question
This was a really great talk and my notes could never do it justice.
https://bit.ly/2MNDlZ9
Building a monitoring strategy and gaining consensus - Gregory Parker, Trevor Morgan, Standard Chartered Bank
No monitoring strategy for company
Back to Basics: What do your users want? Where is their pain points. Put the building blocks in place. Forget what you have and focus on what you need.
- Talk to business and tech influencers
- Listen to fedback and understand contraints
- Publish clear and detailed first principles based strategy
- Get feedback from stakeholders, revise early and often
Get teams to plug in. Avoid mandates, generate awareness, encourage modern solutions, enlist champions.
Build a data lake with common event structure
What went well:
- Engaged with customers throughout
- Inclusive approach, extensible data model
- Roadshows, Show and Tell, Awareness sessions
What could be changed:
- Spend more time gaining consensus early stage
- Work out how to pay for it
- Focus less on legacy technologies
Self-hosted & open-source time series analysis for your infrastructure - Alexey Velikiy
Analytic unit - shuld be isolated and customisable
Hastic - python app for processing ts data & plugin for grafana with ui for labelling and rendering preductions
Label patterns in grafana, and then it will generate detections. Pattern is a “shape” - peaks, jumps, troughs etc.
Custom models in python.
https://github.com/hastic/hastic-server
Monitoring Serverless Things - Mandy Waite, Google
Functions as a Service
By definition, the servers are not accessible. More pieces of monitor and operate.
Retrying function executions is the simplest way to handle failures with serverless functions. Making a function idempotent is required to make it behave correctly on retried execution attempts.
Two distinct variants of functions - http functions, at most once. background functions, at least once.
How AI Helps Observe Decentralised Systems - Dominic Wellington, Moogsoft
We are living in a different world from the one our systems and processes were designed for
Old world: Static environment, managable alert volumes.
New world: fast growing, fast changing environment, massive alert volumes.
What happens on network edge is now more important, and the edge is far away.
Single faults no longer cause impacts: fault tolerance does not mean zero incidents.
So how do we fix monitoring?
Existing monitoring is incident driven. Assumption that faults are easy to detect, and all failure conditions are knowable.
Dashboards are artefacts of a past failure. Internal health is irrelevant, user requests are what they care about. (Symptom based monitoring)
Observability: continuous stream, high cardinality, build into infra and apps, insight driven. “Actionable Understanding”
Monitoring as it should be: everything passes over a message bus. Then add AI.
AI in IT ops: bring interesting information to the attention of human operators - without having to define it beforehand.
Where to use AI in IT ops:
- Ingestion: reduce noise and false alarms.
- Correlation: identify related events across domains, avoid duplication of effort and missed signals.
- Collaboration: intelligent teaming, root cause analysis, knowledge capture.
Teaching the machine. Inputs matter, choose the right feature vectors. Regression problems: continuous distribution. Classification vs clustering: set of dategories.
In Practise:
- Speed matters, work in real time
- You don’t know what you need to know
- AI is a tool, not magic
- Process is how you make sure it works for users
Incremental-decremental Methods For Real-Time Monitoring - Joe Ross, SignalFx
Statistically grounded approaches: dynamic environments, complexity, volume.
Demands streaming algorithms for time series.
Simple calculation: 3 sigma. Implementation: rolling windows. Framework: prime and stream.
Rolling windows are natural foundation for streaming algorithms.
Comparing distributons is not enough. Metods for modeling: double exponention smoothing, and detecting non-stationary series.
Forecasting:
level change: current window differs from forecast. mean is a poor forecast.
exponential weighted moving average: more recent data more relevant.
double exponential smoothing: models two quantities - level of the series and trend of the series.
incremental decremental solution. how to remove influence of oldest values in sliding window. store additional state: track influence of the initial terms on the terminal values.
Time series classification:
A time series is stationary if it’s ditribution does not change over time.
level stationary statistic: tests that a series is stationary around its mean
incremental decremental rolling window implementation: algebraic machinations
07 Sep 2018
You don’t look like an Engineer - Monica Sarbu, Elastic
Issues facing females in technology careers, including work/life balance issues and strategies for managing teams to enhance happiness.
Nagios, Sensu, Prometheus - Why a change of the framework does not change the mindset - Rick Rackow, Ebay
NOC team & SRE team
Started with Nagios
- high noise level
- high false positives/negatives
- culture of downtiming
Migrated to Sensu
- dropped/refactored checks
- 20% unrefactored (mistake)
- attempted knowledge transfer
- more downtiming than ever
- less false positives
- high noise level
- no dynamic checks created outside of monitoring task force
“Sensu is shit, let’s get something new”
Migration to Prometheus. “It’s going to solve all our problems”
- event based to metric based
- need to refactor 100%
- less noise IF we follow our principles
- less downtimes IF we follow our principles
What we learned the hard way:
- Involve everyone
- Reconsider everything
- what you monitor and how you check
- reconsider your alerting
Is observability good for our brain? How about post-mortems? - Radu Gheorghe, Rafał Kuć, Sematext
Interactions with tools, people. Learning and daily structure.
Observability/Tools:
- Monitor everything/Alert on everything/Automate everything
- want to see patterns, get stressed when can’t understand why something happening
- humans evolved to be easily distracted, context shifting is expensive. alert fatigue related.
- new technology, status threat - threat to self esteem. barrier to learning
Learning:
- Schools don’t teach us how to efficiently learn
- Apprentice Method: mentoring/tutoring. 30-50% faster. Experienced person also gains knowledge
- Crash Test Method: exploratory testing. encoded in brain as experience. Need basic knowledge as starting point.
- Dancer Method: 5-30% data retention from reading. needs to be reinforced with practise.
- Place Switch Method: Switch places/roles in organisation. Encourages you to learn and extend knowledge.
- Parrot Method: To share knowledge, rehearse. Combine reading with emotions, imagine crowd - visualisation.
- Mastering Method: Taking notes. Writing reinforces knowledge. Writing is most effective, doesn’t work with typing.
- Box King Method: Take a step at a time.
- Tutor Method: explain to yourself
People:
- Meetings - Meeting in person first matters
- Feedback: naturally wired to seeing whats wrong. constructive feedback doesn’t work and micromanagement bad. need to own your own concerns. share concerns and feelings rather than critising/demanding changes. this lowers status threat.
Structure:
- Eat/Sleep/Exercise. Brain eats lots of sugar
- Morning emails, timebox and use for planning
- Plan all the things
Unquantified Serendipity: Diversity in Development- Quintessence Anx, logzio
Evaluating skills in hires for what diversity of skills they bring to the team.
Mindset Matters. Coach, don’t rescue. Offer information rather than assistance. Provide challenges.
Provide explicit onboarding. Last new hire can onboard new hire, reiterate knowledge and improve process.
How to build observability into a serverless application- Yan Cui, DAZN
survivor bias in monitoring - only focus on failure modes that we identified through experience
could we monitor and alert on the absence of success? something is wrong, but not what is wrong.
otherwise, this talk was repeat of his talk at Monitorama PDX and didn’t answer the questions he posed
Monitoring what you don’t own - Stephen Strowes, Ripe NCC
Easy to monitor things you have control over
Once you put something in the wild you’re at the mercy of other people’s networks - as well as datacenters, cloud providers, CDNs etc.
Service with anycast - traffic easily goes to the wrong place
Which of your users can reach which of your location? Can you isolate a network problem?
You need vantage points to measure, debug or monitor the public network.
RIPE Atlas: global network of measurement probes.
- Allows measurements, you can instruct platform to run measurements and collect results
- Need to run probes to earn credits to spend them on measurements
DNS
- where do ISPs mess with your DNS records? Where are TTLs not honoured?
- querying dns from problam networks can reveal ISP resolver behaviour
Traceroute
- routing is not totally within your control, often asymmetic, difficult to debug without path traces
- traceroutes from many locations give you info in aggregate about congestion/loss along the path
Atlas for Monitoring
- Expose data, allow people to write tools on top of this
- streaming API
- ping: status-checks
- results API
What the NTSB teaches us about incident management & postmortems - Michael Kehoe, Nina Mushiana, Linkedin
Production SREs
NTSB - US National Transportation Safety Board. Aviation, Land Transportation, Marine and Pipeine accidents. Determines probable cause of accidents and reports on findings.
Investigation Process:
- preinvestigation preparation
- go team, ready for assignments: on call schedule.
- investigator in charge (IIC)
- subject matter experts
- notification and initial response
- regional reponse, notify national headquarters
- initial PR and stakedown
- establish severity and assemble go team if necessary
- on scene
- establish command rooms.
- first: organisation meeting, bring up to speed, establish tasks, roles and lines of authority
- IIC most senior person on scene
- daily on site progress meetings at end of day, plan next day
- briefing headquarters
- post on scene
- formal report structure. facts, analysis, conclusions, recommendations, appendices.
- first: work planning and build timelines.
- fact report based on field nodes created
- technical review: all parties review all factual information
- then dedicated department to write report
NTSB advocates for the most important recommendations from their reports each year.
Applying to operations:
- incident commander pre-assigned
- test pagers, ensure access works
- NOC notifies incident commander
- Once verified launch full response for major incident
- mitigate ASAP
- private + public slack channels
- IC establishes war room. assigns roles and responsibilities, and prioritisation. communication at regular intervals to execs. gather data and update timeline doc
post incident activities:
- post mortem
- dedicated team
- template
- blameless
- postmortem rollup
- action items are prioritized
- weekly reporting on status of action-items
The more you invest in the process the more you will get out of it
Vital that there is accountability on improvements and action items. Most action items resolved within one month.
A thousand and one postmortems: lessons learned from running complex systems at scale - Alexis Lê-Quôc, Datadog
Talking openly about failures
Learn from past mistakes, feel kinship in the face of system failure, share what you learned with others
Datadog: lots of data, all day long, every day under tight processing deadlines.
Complex systems almost always are in stable but degraded mode. Each incident is recording noteworthy deviation from what we expect. Most incidents deserve a post mortem - got good at writing them.
Looking back- two extremes: detailed narative on why and fixes, and also high level aggregates and trends
Looking at all in aggregate, formalise anti-patterns into a living document. Invaluable tool for new and old hands alike.
Facing and acknowledging failure in front of others is difficult. It’s a learned skill that needs a safe environment.
Talking about failure in public is even harder. Forget about the specifics and focus on patterns. Recurring themes in why section. Simplify, but keep just enough context to make sense.
Anthology of anti-patterns:
- Configuration: config not immediately picked up, delayed incident. expose config identifier at runtime, assert what runs is what is intended.
- Dependencies: timeouts - loadbalancer timeout of 10s but downstream 60s. expensive requests dominate runtime. downstream services should have timeouts shorter than upstream.
- Deployment: uptime means victory. past results are not an indication of future performance. need explicit sanity checks.
- Development: time, dealing with DST changes. Difficuly to thoroughly test, default to UTC everywhere (except UI).
- Observability: tail of distribution. aggregates and perventiles mask reality of user experience - slowest could be most important. Pay special attention to the tail, check worse requests individually.
- Operations: Expensive roll back or forward. Bad deploy - debate what to do is time consuming. Pick one strategy and invest heavily in it and make it really good.
- Performance: arbitrary resource limits. hard to pick limits for connections, file handles etc. Set reasonable soft limits and ideally no hard limits and let system hit actual resource limits OR reigorously model and validate limits.
- Routing: retry too often. Simplistic retry approaches multiples load on backend systems. Use adaptive retries such as CoDel.
06 Jun 2018
Achieving Google-levels of Observability into your Application with OpenCensus - Morgan McLean (Google)
OpenCensus - distributed traces, tags, metrics (+ logs)
Collection of libraries for multiple languages, instrumentation and support for multiple exporters for tracing and metrics
One thing to do all the things
The present and future of Serverless observability - Yan Cui (DAZN)
New challenges - no agents or daemons on the platform, or background processing, higher concurrency to telemetry systems, adding to user facing latency when sending telemetry in functions, async invocation makes tracing mmore difficult.
Write metrics in logs, as the platform provides logging. Extract that data in post processing.
Async processing - just send metrics in function
Our tools need to do more to help understand the health of the system, rather than a single function
Putting billions of timeseries to work at Uber with autonomous monitoring - Prateek Rungta (Uber)
Built their own TSDB because existing solutions don’t work at their scale - M3DB: https://github.com/m3db/m3db
Lessons learnt in the Sensu v2 rewrite
Autoscaling Containers… with Math - Allan Espinosa
Using control theory to help regulate an autoscaling system
- Iterate on feedback of the system
- Models that tell you if your feedback is effective
- Linear models go a long way
- Re-evaluate your models
Online gaming systems
Nagios constantly full of CRIT warnings. Hostile environment for 1st responders: hard to find alerts in the floor, hard to understand context. Cost of making an incorrect decision is high. Low morale, high turnover.
Plan: Rebrand, Auto-remediation, ???, Profit.
Lots of same tasks being run on the same systems.
System as planned: check results, alert processing engine (calls other APIs), remediation runner. Domains: Detection (Sensu), Decision (StackStorm), Remediation (Didn’t decide).
Review and process all alerts. Migrated many to sensu. Started processing alerts more thoroughly - put all alerts in JIRA and root causes started to be addressed.
Dropped idea of remediation, as alerts decreased realised they had what they needed already - better info for responder, working on fixing underlying causes
Razz: Detection (sensu), Decision (Stackstorm alert workflow), Enrichment (stackstorm widget workflow), Escalation (Stackstorm JIRA workflow)
Monitoring Maxims:
- Humans are expensive (don’t want to waste their time)
- Humans are expensive (make mistakes, unpredictable)
- Keep pages holy (issue must be urgent and for the responder)
- Monitor for success (ask if it is broken, rather than what is broken)
- Complexity extends incidents
- Restoration > investigation
- LCARS: link dashboards, elasticsearch queries, other system statuses, last few alerts
Today:
- Alert volume down
- Data driven decisions up
- Reliability and support quality up
- Team morale up
Security through Observability - Dave Cadwallader (DNAnexus)
Improve relationship between security and ops
Security and compliance concerns handling medical data.
Compliance is about learning from mistakes and creating best practices. Designed with safety in mind, but doesn’t guarantee safety.
Security want to do less compliance, and more time threat hunting. How do we automate compliance checks?
Inspec - compliance as code. Check security in VMs, settings on cloud resources. Community is thriving, plenty of existing baselines available for use.
Run inspec locally, and write out to json. Prometheus to pull the data, custom exporter.
Apply SLOs - actionable compliance alerts. Link back to documentation on compliance documentation. Friendly HTML report pushed to S3 and linked in alert.
How to include Whistler, Kate Libby, and appreciate that our differences make our teams better. - Beth Cornils (Hashicorp)
Talk about inclusivity in tech, how we can improve
06 Jun 2018
Want to solve Over-Monitoring and Alert Fatigue? Create the right incentives! - Kishore Jalleda (Microsoft)
Lessons from healthcare - more monitoring is not always better
Problems of far too many alerts at Zynga. Vision of <2 alerts per shift. Dev on call, SRE for engineering infra and tooling. Zero TVs.
One day massive outage, multiple outages with same root cause.
Idea: Deny SRE coverage based on Alert budgets. Lot of push back - from SRE team and from supported teams.
Baby steps - focus on monitoring and prove we can do one thing well. Promise of performing higher value work.
Leverage outages - Postmortems, follow ups. Build credibility, show you care.
Find Allies - identify who is aligned with you. Need to go out and find them.
Call your Boss - ensure they are aligned. Get buy in from Senior Leaders.
Establish contracts. Targets for all teams. Give time to clean up before launch.
Reduce alert noise - aggregation, auto remediation, what should be a logs or a tickets or an alert.
Success - 90% drop in alerts, 5min SRE response, uptime improved
Next-Generation Observability for Next-Generation Data: Video, Sensors, Telemetry - Peter Bailis (Standford CS)
Taking systems engineering/thinking approach to dealing with speeding up applying ML models to video analysis.
Interesting technology and family of tools being developed.
Chatbots in slack. Commands are AWS lamba functions.
sumo logic queries. benchmarking. user lookup. get/set rate limits. platform-question: assign questions to an engineer, with escalation.
Automate Your Context - Andy Domeier (SPS Commerce)
Complexity is increasing to enable velocity
Context: circumstances that form the setting for an event, statement or idea, and in terms which it can be fully understood and assessed
As complexity increases, amount of available context increases. Eficiency of an organisation directly correlated to how effective you are with your available context.
Goal - make the right context available at the right time.
Context. People, monitoring, observability, obscure and hard to find things.
People: One consistent set of operational readiness values. Operation info, Peformance (KPI/Cost), Agility (Deployment maturity), Security
Monitoring: taking action. Examples:
- Put alerts onto SNS topic. Automate actions with lambda functions. Search the wiki for documentation, post back to alerts commenter.
- JIRA incidents to SNS as well, automate incident communication. Search for recent changes from JIRA.
- Change management in JIRA, dependency lookup & commment back to JIRA.
Slack in the Age of Prometheus - George Luong (Slack)
We replace monitoring systems because our needs have evolved
Ganglia & Librato, migrated to Graphite. Looked at migrating away.
User Problems: metrics difficult to discover. Query performance made for slow rendering. Other problems specific to their usage.
Operation Problems: Could not horizontally scale the cluster (lack of tooling, time and effort). Single node fails led to missing metrics. Susceptible to developers accidentally taking down cluster.
Requirements. User: Ease of discover, fast response, custom retention, scales with us. Operational: Remove single node POF. Teams want to own their monitoring.
Prometheus ticked almost all those boxes, except custom retention and ingestion. (can only be set per box)
Architecture:
- in region: duplicate prom servers, scraping same servers. primary and secondary.
- between regions: single pair of federated servers scraping other prom servers.
Configuration Managemenet: terraform & chef. Prom jobs and rules stored in chef, ruby hash converts to yaml.
Webapp server about 70k metrics, x 500 servers (35m)
Job worker, 79k metrics x 300 servers (24m)
Sparky the fire dog: incident response as code - Tapasweni Pathak (Mapbox)
Sparky the firedog:
SNS topic - lamba function - forwards to Pagerduty
sparky is a npm module
documentation for alarms in github. sparky enriches the alarms.
- reformat the alarm info
- aggregate all your teams alarms into a single Pagerduty policy
- links to targetted searches
- get the root cause analysis?
Future: score an alarm. Does a human need to action this? Based on the triaging/context we have existing in documentation.
Sample questions that need answering on an alert:
- How many errors around trigger time?
- Are the errors ongoing?
- What was the very first error?
- Group and count the errors by time
Is my build healthy? Want to catch errors before causing problems.
Canary - partial deployment. Use canary cluster for canary deploys. Needs production level traffic. Control cluster to compare against canary.
Use statistical tools to compare.
Median Absolute Deviation - maxPercentile
DBSCAN - density based spatial clusering of applications with noise. - toleranceFactor
HDDBSCAN - hierarchial dbscan - minSimilarShardsPercent (minimum cluster size)
Mann-Whitney U Test - tolerance, confidenceLevel, direction
Simplify configuration (of your statistical tests). Sensible defaults speed up adoption.
Choosing metrics - SLOs, existing alerts.
User Trust - Build it.