I’ve given a talk about scaling graphite with go-carbon a few times now, and in a way it was an excuse to try and do some talks at meetups. Really it should have just been a blog post, so here’s that blog post!
There’s a lot of information out there about scaling up the stock python graphite components, such as:
But I’d been hearing about large graphite sites re-writing those components in other languages like C or go to address some of the issues they were having running graphite at scale. When it came to investigating these solutions, the biggest challenge was piecing together an appropriate architecture and configuration for your needs - most of the information for this is hidden in github issues for the project, or spread across different pieces of documentation.
Our Architecture
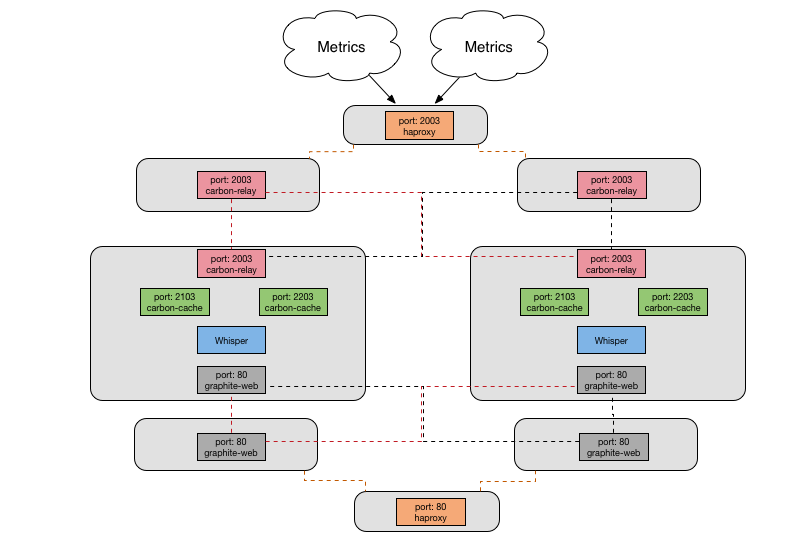
With the python graphite components, we had reached the following architecture to meet our performance and HA requirements.

- Cluster of HAProxy servers, using BGP to route traffic to the active cluster member. This fronts carbon-relay for ingesting metrics, and apache for serving them.
- Two relay nodes, with incoming traffic being split between them by HAProxy, and sending all received metrics to both cache nodes
- Two cache nodes, each running:
- Haproxy to ingest metrics and then splitting the traffic between multiple carbon-relay instances
- Two carbon relay then shards those incoming metrics between multiple carbon-cache daemons
- Four carbon cache daemons to write the metrics out to whisper files on disk
- Apache to run graphite-web and serve metrics
- Two web nodes, running grafana for dashboards and graphite-web to serve a federated view of the cache nodes.
As the amount of metrics we collected grew, the bottleneck we kept hitting is that a carbon-cache process would hit 100% CPU and we would end up dropping metrics. We could keep adding more processes, but that couldn’t go on forever on a single node, and we would have to start sharding our metric data between multiple cache nodes, which I wanted to avoid.
carbon-c-relay
https://github.com/grobian/carbon-c-relay
carbon-c-relay supports all the same features as carbon-relay, but with lower resource consumption and it also supports regex based conditional forwarding to receivers.
But the biggest benefit of changing to carbon-c-relay is it’s larger cache.
The only tuning we needed to do was:
queuesize - default 2500 too low, 5million+
Each configured server that the relay sends metrics to has a queue associated with it. This queue allows for disruptions and bursts to be handled. Constraining the queue size limits memory consumption, but setting it too low risks you losing metrics. We have set it to 5 million, this has provided enough capacity that if you need to perform a short maintenance on a cache node involving a reboot, then we don’t drop any metrics. Previously with carbon-relay this wasn’t the case.
backlog - default 32, we use 128
backlog sets the TCP connection listen backlog. If you have a lot of concurrent connections you need to increase this to avoid connection refused errors on clients
co-carbon
https://github.com/lomik/go-carbon
On the cache nodes we evaluated and decided to implement go-carbon. go-carbon is a Golang implementation of Graphite/Carbon server with the same internal architecture: Agent -> Cache -> Persister
go carbon proved to be a good choice because it has lower resource consumption, and also it’s a single multithreaded process - this removes the config sprawl required when running so many single-threaded relay and cache processes.
It supports all the same input methods as python carbon, plus a few more, and supports that carbonlink protocol that allows graphite-web to query the cache. And it has some neat features, like persisting the in-memory cache to disk during a restart, whereas python carbon-cache would just lose whatever metrics are in the cache during a process restart.
There are a bunch more tuning variables required to get go-carbon working well.
CPU Tuning
max-cpu - this sets GOMAXPROCS. Use number of cores
workers - persister worker threads. Use number of cores
These two settings configure how much CPU resources can be used - obviously, having more persister workers is important for throughput.
Cache Tuning
max-size - set high, we use 10million
It’s important to have a big enough cache size to handle any increases in the rate of incoming metrics, or slow downs in the rate of metrics being written. The number is dependant on the resolution of your data and how many metrics you receive in that period. In our current case, we are receiving about 1.5million metrics a minute, and most of the metrics are 60 second resolution so 10 million is a high enough cache size for now. During normal operation the cache size sits about 1.5 - 2 million.
write-strategy - set to noop
write-strategy defines what order metrics are persisted to disk from the cache. It’s also possible to choose other strategies - either the oldest point first, or the metric with the most unwritten points. noop means “unspecified order” which requires the least CPU and improves cache responsiveness and performance.
I/O Tuning
sysctl settings:

sysctl -w vm.dirty_ratio = 80
sysctl -w vm.dirty_background_ratio = 50
sysctl -w vm.dirty_expire_centisecs = $(( 10*60*100 ))
go-carbon doesn’t try and be too smart about writes - but you need to tune the OS so that go-carbon is never blocked on writes. So we configure these sysctl settings, which come directly from the project README, to tune the kernel disk buffers. The kernel will then take multiple datapoint writes, and coalesce them into a single disk write performed in the background.
- dirty_ratio - percentage of RAM which can be left unwritten to disk
- dirty_background_ratio - percentage of RAM when the background writer starts writes to disk
- dirty_expire_centisecs - this means that memory pages shouldn’t left dirty for longer than 10mins
max-updates-per-second - we use 10k
max-updates-per-second is the most important configuration setting to optimise performance. It’s name is confusing, at first I thought it is a limit on throughput. in fact, once the amount of datapoints needing to be written goes above the setting value limit, go-carbon will start writing out multiple datapoints per update. so this provides control to limit the amount of IOPs the server needs to perform, and means increasing the cache as datapoints need to be stored in the cache for longer so that go-carbon can write out multiple datapoints for each metric per update.
max-creates-per-second - 15
A really useful feature that python carbon supports is max creates per minute, and happily go-carbon started supporting it in 0.13.
The first time a metric is seen, then carbon will lay out a new whisper file. This means writing out the entire content of the file, which is a lot more IO than just updating a few datapoints. This absolutely kills the update performance of the carbon persister and can affect search performance. So, this setting will rate limit the number of new whisper files being created.
I’ve not yet updated to 0.13, we’re running 0.11, but on python graphite we set this to 1000 per minute, so I’d use a similar value scaled down to seconds here.
Resources
Enough cores - 2x Xeon E5-2630 2.40GHz maxed out at 3million metrics/minute in my tests
As for system resources, you need enough CPU to manage your workload, I found I couldn’t scale beyond 3m/min with 2 CPUs in the lab, so we run with more cores in production to give more headroom.
Ram to support disk buffers - was 24GB, maxed out at ~1.2million metrics/minute, now 48GB ... and fast SSDs
The most important resource is I/O throughput. Obviously you need fast enough disks on the backend, but having a large disk buffer in RAM is vital for the operation of go-carbon.
This is because each write to a whisper file requires multiple reads. Also if your whisper files have multiple retention periods, the aggregated points are written to every write, requiring a read of all points in the highest precision that cover that aggregated period. Basically, more cache results in less disk reads.
So there’s a relationship between the max-writes-per-second setting, the size of your in-memory cache, as well as having a large enough kernel disk cache, that provide the tunings required to get the maximum performance for your hardware from go-carbon.
Current Architecture
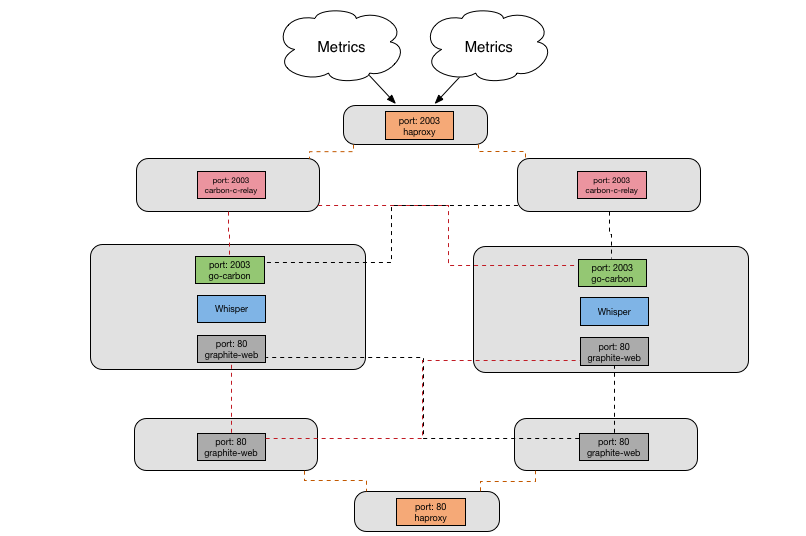
Now we have our current architecture - go-carbon has replaced all the carbon components, as well as haproxy, on the cache nodes. We still have our node sprawl to support redundancy, but the configuration on each node is much more straightforward with one go process and fewer configuration options needing to be set.
